

This article is part of the comprehensive guide on The Ultimate Guide to Building and Managing Your Sales Pipeline. Read our related content on Identifying High-Quality Leads, Effective Pipeline Staging and Management, Nurturing Leads Through the Sales Pipeline, Leveraging CRM for Pipeline Efficiency, Lead Qualification Frameworks, Overcoming Common Pipeline Challenges, Aligning Sales and Marketing for Pipeline Development, and Forecasting Sales with Pipeline Data.
Key Takeaways
- Monitor conversion rates and average deal size: These metrics provide immediate insights into the effectiveness and value of your sales efforts.
- Use sales velocity and win rate to gauge efficiency and success: Faster lead conversion and higher win rates often indicate a healthy, effective sales pipeline.
- Leverage data visualizations: Tools like dashboards and funnel diagrams help clarify complex data, making it easier to make informed decisions and adjust strategies.
The health of your sales pipeline is crucial for understanding the effectiveness of your sales strategies and operational performance.
Join us in learning about the essential metrics that define a successful sales operation, guiding you through the indicators that determine sustainability and growth in sales effectiveness.
The Importance of Sales Pipeline Analysis
Analyzing the sales pipeline is vital for businesses seeking to enhance their sales processes. This analysis offers a detailed view of how effectively a company converts prospects into customers and identifies potential bottlenecks hindering sales performance.
By examining these metrics, you can pinpoint successful strategies that can be expanded and areas where improvements are necessary. This level of insight is crucial for maintaining a competitive edge and achieving long-term growth in the marketplace.
Essential Metrics for Sales Pipeline Analysis

Conversion Rates
What exactly is a conversion rate in the context of sales? It measures the efficacy of your pipeline in transforming leads into paying customers.
For example, if you start with 100 leads and 10 of them purchase, your conversion rate sits at a tidy 10%. It’s a straightforward metric that offers immediate feedback on your pipeline’s effectiveness.
Average Deal Size
Moving beyond the number of deals, the average deal size takes you into the quality territory. This metric assesses the average value each deal brings to your company.
Larger average deal sizes often indicate a focus on high-value, strategic selling, whereas smaller sizes might suggest a volume-based or transactional selling approach. Understanding this can help tailor your sales strategies to drive up transaction values or increase sales volume.
Sales Velocity
Sales velocity is about speed—how swiftly do leads move through your pipeline to become revenue? Calculating this involves understanding four key metrics: the number of opportunities, average deal size, conversion rate, and sales cycle length. A higher velocity indicates a streamlined, efficient pipeline, often correlated with improved sales performance.
Win Rate
The win rate gives you a percentage of deals closed compared to the number pitched. It’s a crucial metric for evaluating the prowess of your sales team in sealing the deal. A declining win rate might suggest a need for better qualification processes or improved sales tactics.
Here are two hypothetical examples of how you can use win rate to gauge sales success:
- Technology Sector: A software company tracks its win rate to evaluate the performance of its sales team. Over a quarter, they noticed a win rate of 30%, meaning they successfully closed 30 out of every 100 proposals sent. This insight helps them recognize the need for better qualification of leads or improvement in proposal strategies.
- Manufacturing Industry: A manufacturer of industrial equipment maintains a win rate of 25%. They analyze their sales processes and discover that improving product demonstrations and client follow-ups could increase this rate. Implementing these strategies, they aim to boost their win rate better to reflect their market positioning and customer engagement efforts.
Pipeline Coverage Ratio
This metric assesses whether the volume of your pipeline is sufficient to meet your sales targets. A pipeline coverage ratio of three times the sales target is typically considered healthy. This ratio helps businesses ensure they aren’t just meeting but potentially exceeding their sales goals.
Implementing Actionable Insights from Pipeline Analysis
Identifying Strengths and Weaknesses
The true power of pipeline analysis lies in its ability to spotlight specific strengths and weaknesses within your sales process.
For instance, a low conversion rate might indicate inadequate lead qualification, while a high average deal size could indicate effective negotiation skills within the team.
Making Data-Driven Decisions
Data from pipeline analysis should serve as the backbone for strategic decision-making. These insights enable sales leaders to allocate resources more effectively, prioritize efforts that drive sales, and adjust real-time strategies.
Adjusting Sales Strategies
Regular pipeline reviews can lead to pivotal adjustments in sales strategies. Whether refining the approach to customer interactions, tweaking marketing messages, or overhauling the pricing structure, the data should guide these decisions.
Coaching and Training
Insights from the pipeline also provide a roadmap for targeted coaching and training initiatives. Understanding where the sales process stumbles allows leaders to tailor development programs that address these areas, enhancing overall team performance.
Using Data Visualization for Pipeline Analysis
Creating Dashboards
Data visualization tools are crucial for converting complex datasets into clear, actionable information through dashboards. These visual tools help maintain transparency and keep all stakeholders informed with real-time data insights. Examples of popular data visualization tools include:
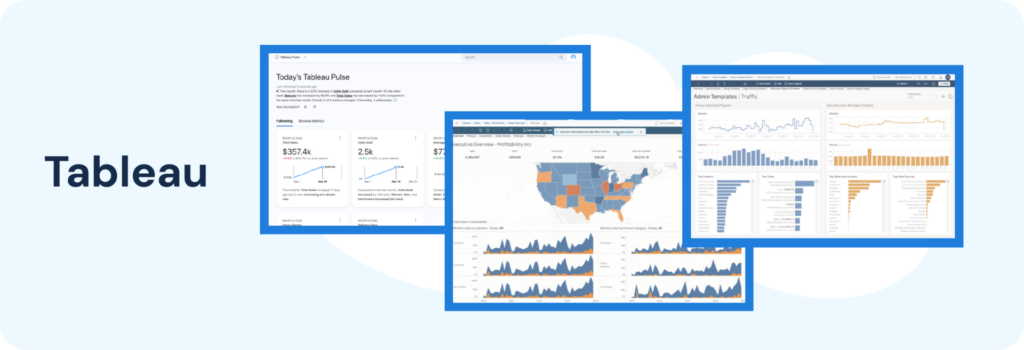
- Tableau: Renowned for its ability to create comprehensive and interactive dashboards, Tableau allows users to explore and share data insights on a highly intuitive platform.
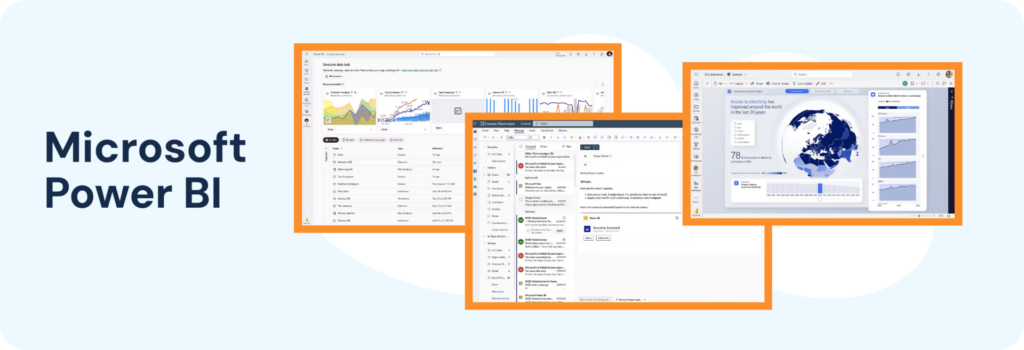
- Microsoft Power BI: A favorite for its deep integration with other Microsoft products, Power BI provides robust analytics capabilities, enabling users to pull data from various sources and compile it into visually compelling dashboards.
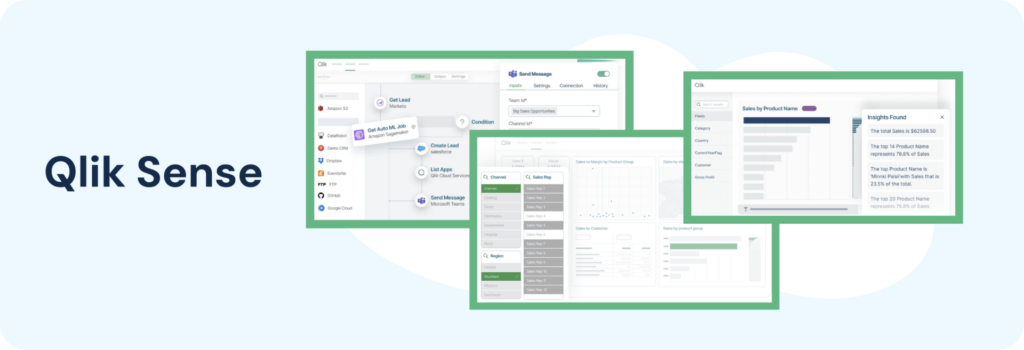
- Qlik Sense: Known for its associative analytics engine, Qlik Sense offers sophisticated data visualization capabilities with drag-and-drop features that help users create personalized, interactive dashboard applications.
Visualizing Funnel Movement
Visualizing the movement of leads through the sales funnel is essential for identifying where prospects drop off and pinpointing stages that may require optimization.
This process involves mapping out each step from initial contact to final sale, allowing teams to observe the flow of leads and detect potential inefficiencies. Some tools that are particularly effective for this type of visualization include:
- HubSpot CRM: HubSpot provides a robust CRM platform with sales funnel visualization tools. These tools allow teams to track the progression of leads at each stage of the sales process, helping to identify where leads are lost and where conversions are won.
- Salesforce Sales Cloud: Salesforce offers detailed funnel analytics as part of its Sales Cloud platform, allowing sales teams to customize their funnel stages and visually analyze the flow of opportunities throughout the sales cycle.
- Zoho CRM: Zoho CRM offers a visual sales funnel feature that helps teams monitor and understand the progression of leads from one stage to the next, making it easier to address inefficiencies and improve conversion rates.
Conclusion
Regular analysis of your sales pipeline is beneficial and essential for scaling and refining your sales operations. By focusing on these key metrics, you can optimize your sales processes, enhance performance, and ultimately drive greater success.
FAQs: Pipeline Analysis and Metrics for Success
What is sales pipeline analysis?
Sales pipeline analysis involves examining the stages of your sales process to understand how effectively your team converts leads into customers.
Why is monitoring conversion rates important?
Monitoring conversion rates helps identify the effectiveness of your sales process and indicates how well your team is converting prospects into actual sales.
What does average deal size tell you about your sales pipeline?
Average deal size indicates the value each transaction brings to your company, helping you understand the profitability of your sales efforts.
How can sales velocity impact business performance?
Sales velocity measures how quickly leads convert into sales, impacting overall business performance by showing the efficiency of the sales process.
What is the purpose of using data visualization in sales pipeline analysis?
Data visualization in sales pipeline analysis helps clarify complex data, making it easier to identify trends, patterns, and bottlenecks in the sales process.
